RCFA update 1: Turning mediocre images into ugly music via pretty colors
Posted by r on February 28, 2014
Much as I may believe in leaving room for some cough musical intuition, I like coming up with and using compositional processes of all kinds too. They can speed things up– although they invariably slow other things down at the same time. Mostly, though, they do accelerate decision-making for the horrifically-indecisive likes of me, and keep one from getting constantly lost in an infinite field of options (even as possibly narrowed down in scope by one’s cough musical intuition).
I’ve occasionally liked playing with ye olde serialized-pitch constructs, the kind you’d instantly think about whenever you see a picture of Arnold “Fun Machine Arnie” Schoenberg (provided you’ve ever been through any kind of formal concert-music study). Every couple of years I seem to do something old-school-serial in nature; it’s a fun system that’s ready to go off the shelf.
I thought heavily about using serialized pitch for my RPM now-part-of-my RCFA Challenge project, as I did want some kind of system to steer pitch elements somewhat out of my control. At the same time, though, I also wanted to be able to use a bit more arbitrary / systematically-unchecked personal choice than serialization in its usual form would really allow.
Besides, another thing I often dig is finding some way to incorporate “personal message encryption” into music – giving the finished product a “deeper” dumb meaning for me while totally obscuring that “meaning” for anyone else dumb enough to listen to the finished thing. I thought it might be fun to come up with a way to “encrypt” images into my pitch selection process for this project. Here’s what I’ve decided to go with.
First, one starts by selecting an image that will uhhhh inspire the song being created. Let’s go with this particularly creepy Piglet as an example, because I had it sitting around on my desktop.

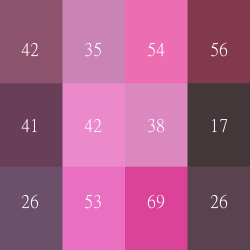
The traditional Western pitch-class universe has twelve pitches, each of which will be mapped to a portion of the selected image. To begin this process of pitch-from-image, the selected image is broken into twelve equally-sized subsections, and the average / dominant color of each subsection is determined in image editing software. Here’s what Piglet looks like when broken up and “averaged” into these twelve “regional colors.” (Chiptune artists: obvs this would make a pretty great album “jacket” as-is for a full-album chiptune cover of MBV’s Loveless, so get to it.)

In this case, Piglet is broken into a 4×3 grid of color-cells, the layout of which I’ve chosen to map onto the twelve members of the Western pitch-class universe in fairly obvious order:
0 1 2 3 [C C# D D#]

4 5 6 7 [E F F# G]

8 9 A B [G# A A# B]
Using the same software (GIMP, natch) that has done the “color averaging” on the image, I go in and read each cell’s color saturation level as expressed by GIMP on a scale of 0-100. (The color itself is not of course reverse-decipherable with only this amount of information, so between this and turning every picture into an Atari-esque mass of essentially twelve “pixels,” the pictures themselves could never be “decoded” by even the most absurdly determined musician-cryptographer.)
Here are the GIMP-reported saturation levels for each of the twelve cells comprising Atari-Piglet.
I’ll essentially use these reported numbers as rough probability guidelines for each pitch class of the available twelve. However, I will not be ensuring that each pitch is precisely / statistically-accurately represented according to these numbers in the finished product. Not only would this be an enormously tedious thing to do, I am not nearly smart enough with probability and honestly wouldn’t have a clue how to pull that off. These are just guidelines for my further reflective intuition as I’m writing.
One final element of this pitch selection process I haven’t discussed, though, is that I’m planning to associate particular subsets of the twelve-tone aggregate with sections of the songs’ forms, with the form of each song already having been determined in advance of writing even a single note.
By way of extremely simple example, let’s say this Piglet-based song in progress has only A and B sections. I might choose to use the “top six” cell values to help govern pitch material for the A section, and reserve the remaining six PCs / hexachord for the B section.
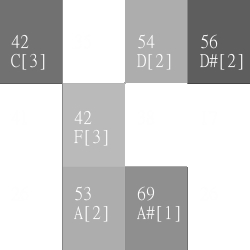
…Yeah, let’s pretend to do that. Below, I’ve blanked out the six “lowest ranked” cells of Atari-Piglet, which presumably will end up as pitch class material which is only possible to encounter in the B section of the finished song. The six remaining “top ranked” cells will be the six possible pitch classes in my A section – which, by the way, I really ought to start writing if I’m gonna finish this “album” by March 26.
To get started on writing the A section riff or what-have-you, I first divvy up my remaining “top six” PCs into a simple three-way hierarchy for that whole guided-approximate-probability thing, and again use the original saturation index for that PC-cell to determine which pitch classes go into which level of selection hierarchy.
The image below (now in black and white) also shows three pieces of information for each of the six remaining cells: 1) the original saturation index, 2) the pitch class that “translates” to the cell’s location, 3) in [brackets], the level of the three-way rough-probability hierarchy to which that pitch belongs.
The most saturated cell, the 69 mapped to pitch class A# / B-flat, is the most probable – thus, [1]. This is effectively going to be the tonic note of the A section.
I’ve arbitrarily divvied up the remaining five PCs on an “every ten” scale. The three cells that had saturations in the 50-59 range become second-most “probable,” and the remaining two 40-something cells will all be the “least probable” (quotes because, again, I’m just not going to go through and count numbers of attacks on those PCs or what-have-you to make sure I’m coming up with something 100% accurate in terms of true probability; it will be a try-my-loosely-gripped-best sort of thing).
The three-way hierarchy of likelihood is meant to sort of replace the tonal-music tonic-dominant-predominant hierarchy of function. Any of the three PCs in “rank 2,” for instance, will be used in ways / places that might normally be a “I’d think a dominant harmony of some kind should go here” moment in time. Any of these rank-2 pitch classes can be combined as a verticality, used singly, or sequentially in any order, or blah blah blah.
The same breakdown-and-functional-likelihood mapping would then be repeated, in this case, for the B section with the “lowest six” PC-cells in terms of saturation.
All of the above is a “simple”, relatively black-and-white example of what I’m going to try to do here in terms of using images and subsequent data-reading to help me make pitch decisions on the fly. There are no hard and fast rules in general, though, for how I’ll be choosing to map “probabilities” nor determine which PCs belong to which formal subsection, and I’m certainly not ruling out some degree of pitch-class overlap between sections of any given song.
Final sidenote: theoretically-astute readers may recognize that in the above example, the pitch-class universe occupied by each proposed formal section is actually fairly tight / small, particularly given an end product that will be realized with loud rock guitars and etc. That’s actually by design, as limited / sparse pitch selections are a key part of the steering-aesthetic I’ve been dreaming up for this project. I may choose to explain further as the project progresses, or I may not (OH THE SUSPENSE).
Alternately, I may just shitcan the whole thing, drink half a handle of my new-favorite liquor Fireball, and make “Rock Factory II” whenever I can manage to not fall off the DAW-chair onto the floor.
Sorry, the comment form is closed at this time.